Dec 27, 2025

COPA Top-Down Distribution using the new Fiori app "Manage Allocations"

 A few months ago, I started working on a client business requirement to do Allocations in Margin Analysis (formerly known as COPA or Profitability Analysis) to allocate certain overhead costs using the COPA Top-Down Distribution functionality. I worked with it several times in the past with the old KE28 and lately with the new "Universal Allocation" functionality using the new Fiori App "Manage Allocations".

The business requirement that I had was a bit unique that I did not know if it was even possible to achieve it. Finally I was able to make it work, so I decided to make a post out of it since, as usual, I like to post things that I did not find on the Internet so the community can benefit from it.

We will start from the beginning with a bit of details about it ...

As a previous step for this Top-Down Distribution Allocation (TDD), we did a Margin Analysis - Overhead Allocation from Cost Centers into a high level Profitability Segment like Company Code and Profit Center using an Assessment Allocation Cost Elements (In our case, an account starting with 942xxx). Once we had executed this Overhead Allocation, that will leave us the postings in a high level Profitability Segment that will then be picked up by the TDD.

The TDD will spread (re-post) the values on a proportional basis based on Ex. Sales Qty (KG in our case). This reposting is done within the same Allocation Cost Element / GL Account (Ex.  94200200 – Distribution Costs). At the end resulting in a reclass within the same account. So, each Sale transaction record will be used to have its proportional / fair share of those Overhead costs being allocated.

We had 2 different type of business requirement that we can summarize like this.

 2 different types of TDD,

Simple (Cost from Cost Center are Allocated / Spread based on the Sales of the same Company / Legal Entity)

Complex (Cost from Cost Center reside on Legal Entity A but are Allocated / Spread based on the Sales of the Legal Entity B)

Note: the term Simple and Complex are not SAP terms.

The Complex TDD was the one that was quite unique and the 1st time I faced such a requirement, so I was not even sure it was possible nor I was able to find anything online that would indicate that. Thus, the reason for my Blog today.

Simple TDD


This is how we will build a TDD Allocation cycle for a "simple TDD".


Will create the Cycle with code, description and a Valid to date.
A TDD Cycle can only have 1 Segment, different to the other types of Allocations that allow for multiple segments.


Based on “posted amounts” (actuals) and variable proportions.


Senders we leave it as-is, no changes required.

Here we need just a few dimensions, not all the ones available for Sender Basis. So, we will need to remove a few of them and leave the ones above.

Account number: We will use the specific group called TTD_CE created for this that contains all our Allocation Cost Elements type 42, since we used more than one Assessment account starting with 942xxx. By doing a group, we can re-use it for other cycles easily and we don't need to enter all accounts manually.

Our Company Code is 1000.

Remember ... prior to this, we had our postings already done at a high Level Company Code and Profit Center.


Receiver we leave it as-is.


This is where we will match the “Sender” data with the “Reference data” (our Sales).

Variable Portion Type: QUANT1 – Quantity 1, so based on our Sales Qty.

Profit Center: ALL VALUES , to take into account all Profit Centers

Same for Functional Area and Segment.

Account Number: will put our Sales Account. In our example 41000009

Now at the far right, each Selection Criteria characteristic has an icon that we need to click to expand our input for the "Reference Base" (Our Sales data matching).

Profit Center Mapping, we need to do a 1:1 for all Profit Centers involved on the Sender and Reference side.


For Accounts, we will map every account that is part of the TDD_CE against our Revenue account (like above)

If we have more than 1 Revenue Account, then we can create an Account group that will include the several revenue Accounts. This will be used in the “Selection Criteria” and in the “Reference Base Mapping”.

Company Code 1:1 

Functional Area, Segment, etc. ALL to ALL.

Complex TDD

In the “complex TDD” scenario, we want to Allocate (spread) the Expenses / Costs of one CoCode, but based on the Sales of another CoCode. Ex. Allocate Compay Code A Expenses, but based on Company Code B Sales.


The creation of the Cycle is the same as before for simple TDD scenario, with minor tweaks.


Sender Basis in this case is for the Expenses of Company code 2000.
Receivers stay the same.


Receiver Basis stay the same as in the Simple TDD scenario, being the Company Code 1000 (the one with the Sales).

With this Reference Base Mapping setup 2000 Sender and 1000 Reference Data, we are telling the Allocation to use the Costs of Company Code 2000 and reference it with the Sales of 1000. Just this little tweak in the Reference Base Mapping is key for this cross Company Code Reference Data to work.

Note: the Allocation postings will still remain in the same Legal Entity / Company Code, in our case 2000 and will not be generating any Cross Company Code postings. It is just for the reference calculation the Cross Company Code specification.

All the other Reference Base mapping still apply the same as in the Simple TDD scenario. The only one that is different is the Company Code one (like above).


Note: Margin Analysis Top-Down Distribution Cycles CANNOT be downloaded and/or uploaded using an XLS Template like the other Allocation Cycles. Instead, they will have to be created manually in each environment (Ex. QA and PROD). But, once 1 Cycle is created, a COPY function is available and then you can modify the parameters for that cycle accelerating the creation.


If your Company and/or Project needs to implement this, or any of the functionalities described in my Blog, or need advise about them, do not hesitate to reach out to me and I will be happy to provide you my services.

Jun 27, 2025

Creating a Mass report for Actual Costing CKM3n beloved transaction

For those of you that work or have worked with Actual Costing, I am sure that you have used, and continue using every day, Transaction CKM3n - Material Price Analysis. This is the go-to report / transaction to analyze the costs and actual costs of a given material during an accounting period. This is "the bible" for Actual Costing information on Materials.

The transaction is really nice, it gives you a lot of information on Receipts, Production, Consumptions, Deliveries, Revaluations on a Standard basis as well as including Actual Costs. There is "almost" nothing better out there in standard SAP Actual Costing than this transaction. But ... it has a very big limitation, you can only display 1 Material at a time in 1 Plant and for 1 Accounting period at a time. There is no other good transaction for many Materials. If you are dealing with multiple plants and multiple materials, then it is going to be hard to do multiple analysis. (some would mention KKML0 as an alternative, will there shortly ...)

Another good piece of information that this report provides you, is the breakdown of the figures by Cost Component (considering you have activated Actual Cost Component Split in your system).

As you can see above, you get a lot of valuable information like Beginning Inventory, Revaluation, Receipts, Consumption and finally Ending Inventory; which is also something really nice that many Cost Accountants would need (All the In's & Out's during the period).

Note: To be able to obtain all these calculations in CKM3n, you need to be using Actual Costing and running it on a monthly basis. Otherwise, this transaction will show you only "Price History" information which is line by line each transaction, the standard cost, quantity, etc. Only with actual costing you will have calculated beginning and ending inventory and their corresponding "price difference" (Actual costing).

Now if you want to do a Mass report for the information in CKM3n, you will have to build a custom report for it; which I will explain you what will be your source tables for this information.

In the picture below you will have a more detailed and exploded view of the different categories in CKM3n


You can easily reproduce these with the 3 Tables below, which I will explain each of them:

FCML_MAT_V  
FCML_REP_V
FCML_CCS_REP_V

Will start with the 1st Table FCML_MAT_V

This table has the "Master Data" type of information (Ex. Plant, Material #, Description, Valuation Class, Profit Center, Company Code and the most important one "Cost Estimate number", among some.


If you are also dealing with Customer Stock or Project Stock, you also have the Stock Type, Sales Document and line item number as well. Same as you would need to enter in CKM3n.  


Next Table FCML_REP_V

The link between the 2 Tables is the "Cost Estimate Number". Here you also have a way to restrict by Posting Period, Fiscal Year and Currency Type (10 for Company Code, 30 for Group this will depend on your Material Ledger currency setup). If you do not restrict the data, you will get for that same material all accounting periods out there for all your ML currencies.
These should be part of the available selection criteria in your future query.


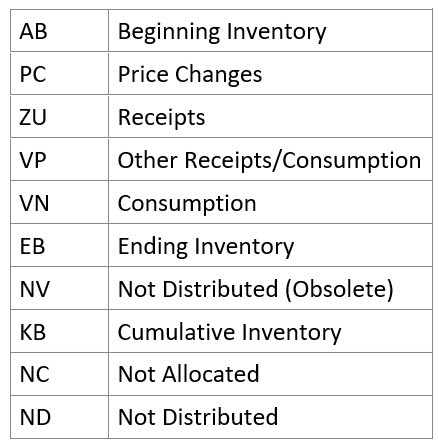
Once you restrict your data, you will see that this table shows the different Categories that you get in CKM3n (Ex. Category AB will represent your Beginning Inventory, ZU - Receipts, ... and EB - Ending Inventory). 

Note: Unfortunately there is no check table for the Category list of values as this is a Domain with a list of values. These are the different values


Each Material / Plant combination will have many records for a given period because of the multiple categories. (so eventually they need to be aggregated)

In the example below, you will see side-by-side CKM3n and the corresponding FCML_REP_V record.
You could clearly see the "Total Stock BUn" column representing the Quantity for Beginning Inventory (Category = AB), and the "Total Val" representing the $ amount. Then you can continue with the other Categories like VN - Consumption and EB - for Ending Inventory.


For Ending Inventory (EB) you will need to aggregate (sum) multiple EB records to obtain the Total Value, Quantity and in this case the CKM3n Settlement line (Actual Costing) for ending inventory value, is represented by column "1LvLPrDif". Which it will apply for Beginning inventory for next period. (In my records, I did not have a settlement for beginning as it was my 1st data period).


For Consumption (VN), you will also need to aggregate more than 1 VN record. Again, the Price Difference column or in this case what would show in CKM3n as a revaluation line, will be represented in column "1LvLPrDif".


Finally, the 3rd and last Table FCML_CCS_REP_V
This table represents a deeper level in our CKM3n information. This will give you each of the prior  inventory movements categories broken down by Cost Component.

Same as before, the link is Cost Estimate Number. Of course, this table also needs to be filtered by Posting Period, Fiscal Year, Currency type, etc.
You most likely need to aggregate records as you might have several for the same Cost Component and category.
Here you will have in the field "Cost Component" the component code and then you will also have the Cost Component text description already. 


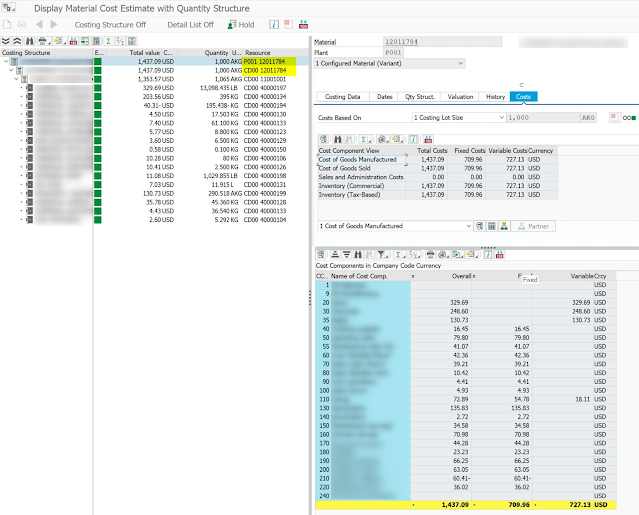
This Component breakdown is what you will normally see in the far right of your screen within CKM3n transaction.

In the image below, you will see how in this example the records in Table FCML_CCS_REP_V match the consumption line of the Cost Component 20 (see Table and CKM3n side by side and highlighted).
The Cost component amount is the sum of either PRCDIF_VAR Crcy field or PRCDIF_VAR_S field.


In the case of another Cost Component like 110, is the sum of 2 fields, so you need to include Fxd Value as well. So, at the end, it is better to aggregate and sum both fields for any of the scenarios. This one has a value for Fxd Value (because this component is about fix costs, and the prior example CC 20 was about variable costs).


Now that you have all the necessary Tables that provide CKM3n equivalent numbers, you are ready to build your query. With the help of a good Abaper, he can easily join these 3 Tables and turn them into a new CDS view that ultimately can be turned into an Analysis for Office (AfO) query or he can even encapsulate this into a Fiori App using SAP Web Dynpro. I personally prefer AfO or the old Design Studio that would be easier to drag & drop on a pivot table like navigation. Web Dynpro has replaced it, but I prefer the old one that uses less square footage in your screen.

Not sure if you realize, but all these 3 FCML* tables are also standard CDS views that SAP has built. I just don't understand why SAP has not turned them into a proper report and/or Fiori App yet for Material Ledger reporting. They should do it already ! 


Note: I said before that one alternative to this could be to use Transaction KKML0. In my personal opinion, should not be something to be used now a days in S/4 HANA (but there is nothing better yet). This uses a really old SAP technology, "Drill-down reporting" which also uses Report Painter behind the scenes (even older ... 😠 ). You could obtain part of the same information, but not with Cost Component. Then when you will try to export it, it results in a tremendous amount of columns because every combination of CKM3n (row & column intersection) will end up as a column. Not really nice at the end. 


What needs to be activated for the FCML* tables to work ?

Oss Note "2441212 - ML Drilldown Reporting - use CDS views FCML_MAT_V, FCML_REP_V" explains it. It also mentions that this is only available on S/4 HANA versions 1610 and higher for Plants with Activated Material Ledger Actual Costing.

What the Note also says, is that once that in place, KKML0 (Material Ledger drill-down reporting) will be using these series of CDS views. So at the end, my solution is tapping into the same set of Tables. But, if we encapsulate or expose these CDS views to be used in AfO or in a Fiori App, you end up having a way better front-end than the classic Drill-down reporting.

There are quite a few Oss Notes talking about these series of ML tables too.


If your Company and/or Project needs to implement this, or any of the functionalities described in my Blog, or need advise about them, do not hesitate to reach out to me and I will be happy to provide you my services.

Mar 27, 2025

Using S/4 COGS Split when shipping to customers out of non-Manufacturing Plants

Starting from S/4 HANA version 1709 and upwards, SAP introduced a new functionality for COGS (Cost of Goods Sold) split when posting your a PGI (Post Goods Issue) automatic journal entry.

Up until this version and traditionally in SAP ECC version, we would post a 1 liner COGS entry for the total standard cost of the material (* Qty) of the product being delivered to the customer. This was the standard in SAP and has been like that since SAP existed. Many other ERP systems do the same, posting of the Cost of Good Sold entry is done with just 1 line to represent the COGS. Also, when we were using Costing based COPA, we would create as many Value Fields as Cost Components we had and when performing the Billing the system will post into COPA this sort of COGS Split among the different value fields. But from a pure GL posting perspective, this was not yet possible.

Our Journal Entry used to be like below:

Debit - Cost of Good sold (PL)

Credit - Inventory (BS)

Now a days, the recommended approach with S/4 is to use Account based COPA and not Costing based COPA anymore. Account based is the way to go today.

(Note: you can still use Costing based, but it is not the recommended approach anymore for new S/4 greenfield implementations. For the old SAP guys, like me, we grew some grey hair trying to explain the "unbalanced" situations of FI vs. COPA. So, we don't want go back to those days anymore). 

By using this new functionality, the system would create a 2nd Accounting Document right after your PGI posting that would offset the original COGS account and Debit your different COGS Splitting accounts that you would have configured to show your different Cost Components that you defined in Product Costing configuration (OKTZ).

Example:

Debit - COGS Cost Component 1

Debit - COGS Cost Component 2

Debit - COGS Cost Component 3

Debit - COGS Cost Component NN

Credit - Cost of Good sold (PL)

Now, the purpose of my posting is not to talk about how to configure this specific functionality. For this, you can find other nice posts that have been written on this topic by colleagues of mine.

I can recommend this one from SAP Press

https://blog.sap-press.com/how-to-split-cost-of-goods-sold-cogs-with-sap-s/4hana-finance

The purpose of this post is how to make COGS Split happen when you ship to your customers out of downstream Distribution Centers and/or 3PLs Plants / Warehouses.

When you ship to your customer from your Manufacturing Plant, and you activated COGS Split, it will naturally post your COGS Split.

But, many companies, have a downstream series of Warehouses, Distribution Centers and/or 3PLs that receive their goods from the Manufacturing Plants via Intra Company STO's (Stock Transfer Orders). And, only from there they ship to their customers.

Since these Warehouses were not the ones that manufactured the goods, you would normally don't have Cost Estimates there that would allow you the possibility of having calculated Cost Components to eventually derive that. In that case, you will have to use another Product Costing functionality that will be used when setting up your materials at these Warehouses. This functionality is called "Special Procurement Key for Costing".

With the setup of these key/s, you will specify, from which Manufacturing Plant the Warehouse will pull his costs and with that, it will also inherit the Cost Components Split. So then, when doing the PGI from the Warehouse, the system will have a Cost Component Split in that warehouse and will be able to post accordingly.

This is how you would configure this Special Procurement Key:

IMG > Controlling > Product Cost Controlling > Material Cost Estimate with Quantity Structure > Settings for Quantity Structure Control > Material Data > Check Special Procurement Types (Tcode OMD9)


Here you will define a new "Key" where you will specify: 

Procurement Type = "F" for External Procurement (Plant P001 will get its cost externally from another Plant. By externally, it does not meant from an outside Vendor).

Special Procurement = "U" for Stock Transfer (via STO).

Plant = Ex "CD00" the Plant that it will be getting its cost passed from. 

Note: that 1 Special Procurement key will be needed per Plant. So if you have 10/20 Plants retrieving its costs from CD00, you have to configurate this 10x/20x. The good thing is that since it is Plant specific, you can name them all with the same code / key. Ex. each of the 20 Plants will have its own Z1, easier for organization purposes.

One Material, can have its costs derived like this from 1 Plant at a time since this key is assigned in the Material Master at the Plant level. In our case at P001 we will assign ZD.


Once you have this, you will be able to create / assign to your Material Master record this Special Procurement Key in the Costing 1 Tab.


After setting up your Material Master record, the last step you will have to do from now on, is to include in your Costing Run all the downstream Plants for which you configured and assigned Materials to this Special Procurement Costing keys.

When you calculate your Cost Estimate for a Material, you will clearly see (below in yellow) that Plant P001 is deriving its cost from Plant CD00 (same Material number).

Note 1: You do not need to setup BOM and/or Routings in these downstream Plants to achieve this, just the Special Procurement Key for Costing. BOM and Routing remain necessary only for Manufacturing Plants.

Note 2: In this model, we are not considering any value added like Freight and/or Customs to the inventory value when moving from one Plant to the other, we are staying at the same cost. This can be achieved with other functionalities that are not part of this post.


Now when posting a PGI from Plant P00, you will have exactly the same effect and type of postings that you would achieve as if you were PGI'ing from a Manufacturing Plant and will show the Cost Component Split posting


Material Document for Movement Type 601 - Delivery to Customer will create 2 Accounting Documents.


First Document, posts the traditional COGS posting.


Second Document, posts the COGS Split posting as you defined in your COGS Split configuration but in this case from Plant P001 which is Distribution Plant and not a Manufacturing Plant.

Note: the COGS split configuration is done at the Company Code level, no configuration is required on a per Plant basis. Once done, it will apply to all Plants within that Company Code.


If your Company and/or Project needs to implement this, or any of the functionalities described in my Blog, or advise about them, do not hesitate to reach out to me and I will be happy to provide you my services.